
2026 Board Index Director Snapshot
Class of 2026: S&P 500 boards appoint more CEOs
Board refreshment slows
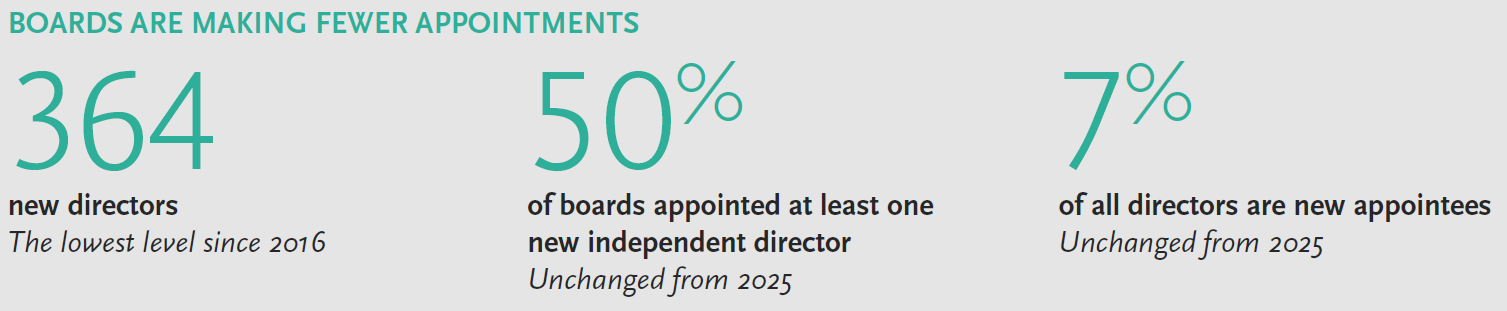
S&P 500 boards appointed 364 new independent directors in 2026, out of a total of 5,204 — the lowest number of new directors since 2016. Overall turnover remains low, declining from 0.8 new directors per board last year to 0.7 in 2026.
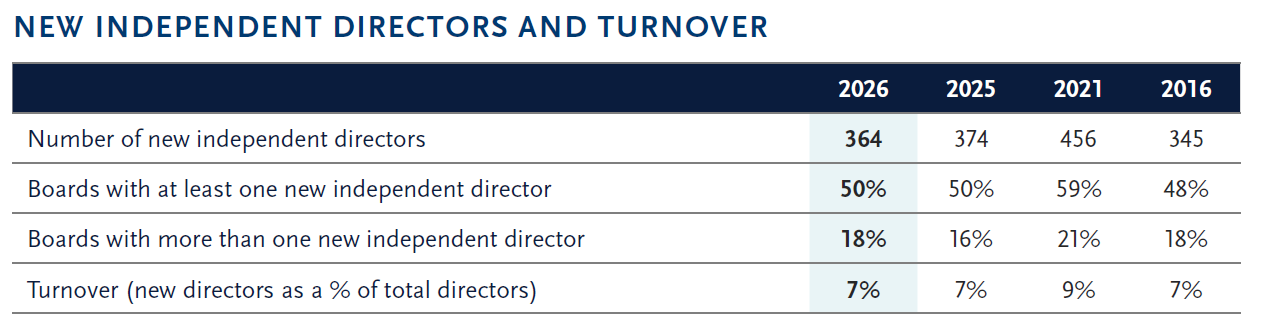
In previous years, declines in director appointments generally mirrored the number of directors leaving boards. For example, 374 directors departed S&P 500 boards in 2024, matching the number of new director appointments in 2025. That pattern did not continue in 2026: 418 directors left boards last year, 15% higher than this year’s appointments.
Highlights: New S&P 500 directors
CEO backgrounds take priority in the boardroom
S&P 500 boards appointed fewer directors this year, but more of these new directors have proven executive leadership experience.
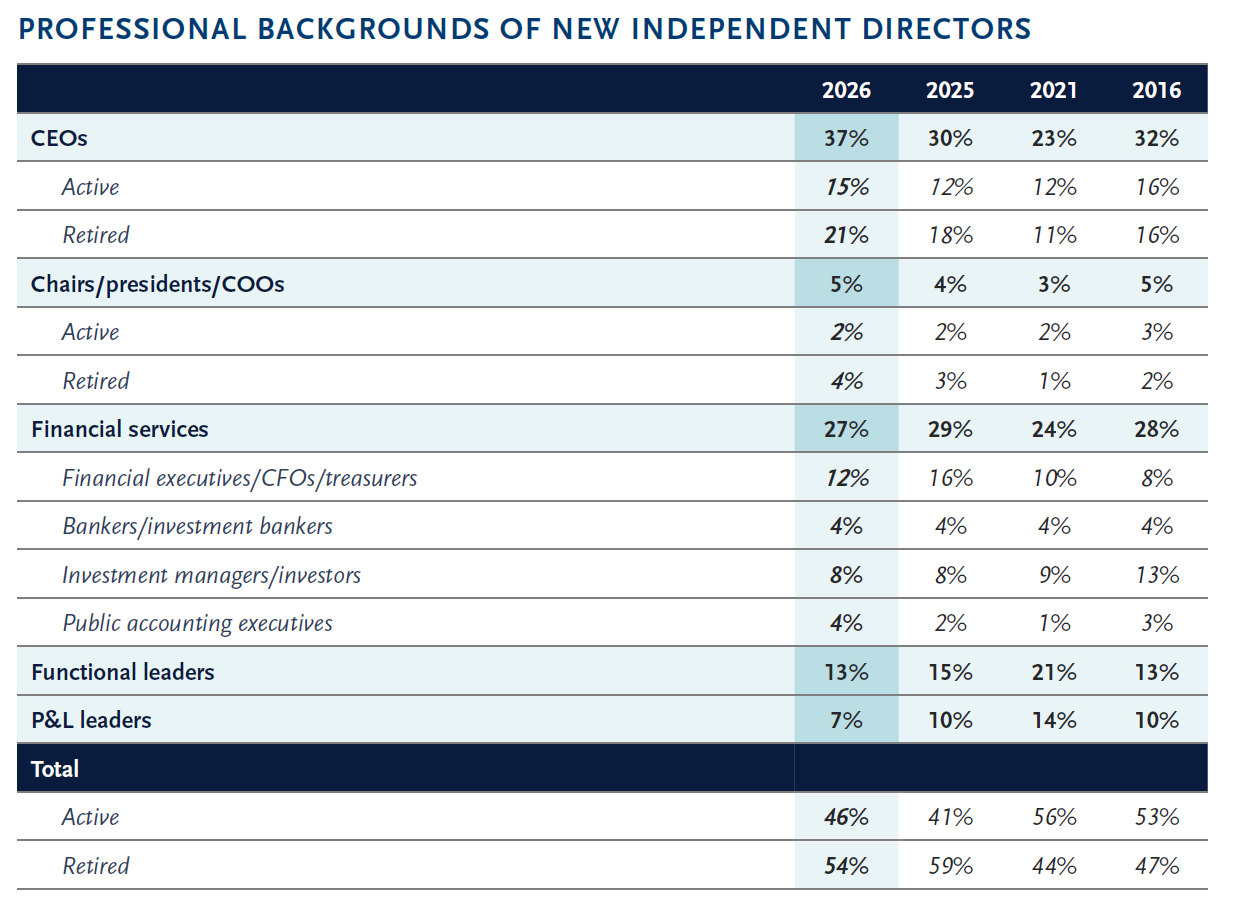
CEOs and financial pros dominate new appointments
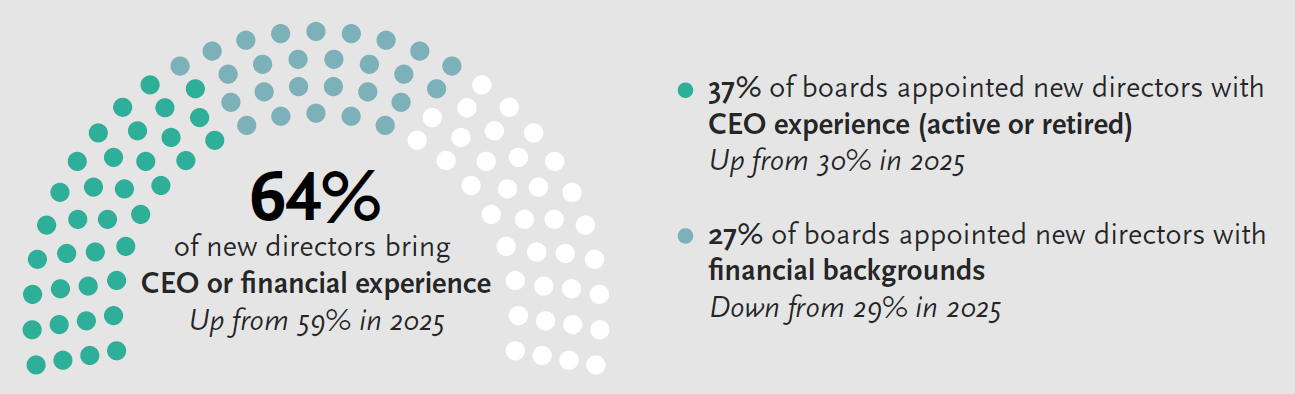
This year, 37% of all new directors are CEOs, an increase of seven percentage points from last year. This is the highest share since a peak of 42% in 2012. Overall, 64% of incoming directors bring CEO or financial experience, up from 59% in 2025.
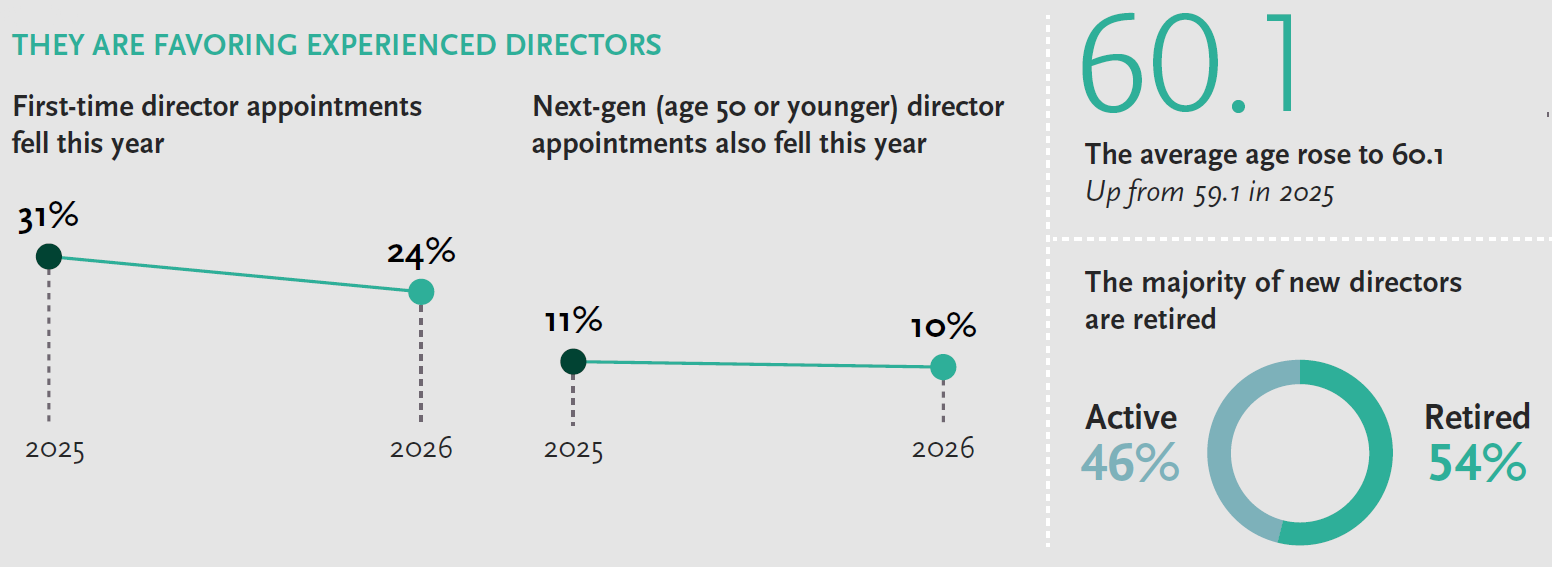
Retired individuals again represent the majority of appointments.
Younger director appointments continue to decline
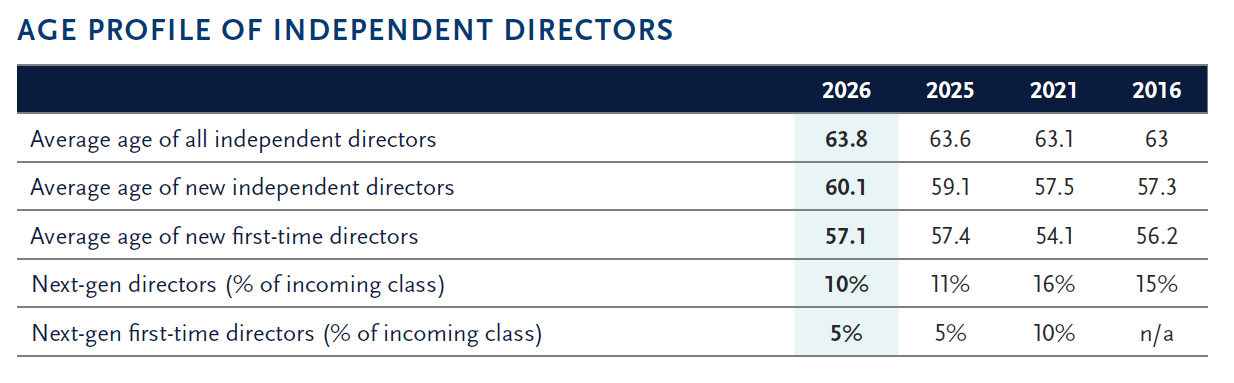
New directors averaged 60.1 years of age, up from 59.1 years in 2025. The youngest new director to join a board in 2026 was 29 years old. The oldest was 77, the same as last year. The average age of sitting independent directors is 63.8.
Next-generation (next-gen) new directors (those aged 50 or under) represent 10% of the incoming class, down from 11% in 2025. The majority (86%) of next-gen appointees are actively employed.
First-time director appointments also continue to decline
First-time public company directors account for 24% of the class of 2026, down from 31% last year and 34% in 2024. Most (62%) are actively employed, compared with 40% of directors with prior public board service.
More than half of first-time appointments (55%) offer financial experience or functional expertise. Financial executives (CFOs, bankers, investors and accounting executives) make up 34% of the first timers.
Fewer independent directors retired from boards this year
In 2026, 377 independent directors left S&P 500 board service, down 10% from last year. Departing directors averaged 67.5 years of age and 11.3 years of board tenure. As in previous years, most directors left boards in their 70s (50%); 37% departed in their 60s.
Fewer departing directors are subject to mandatory retirement age policies: 63% in 2026, down from 69% in 2025 and 73% in 2024. Among those subject to such policies, 32% retired on or after the mandatory retirement age, up from 30% last year, and 55% left more than three years before reaching it.
Directors subject to mandatory retirement policies left 6.4 years before the mandatory retirement age, compared with 6.2 years in 2025 and 5.6 years in 2022. The share of departing directors with at least 15 years of tenure fell sharply, from 30% in 2025 to 17% in 2026.
Women independent directors continue to join and leave boards earlier than men. New women directors are, on average, two years younger than men and are more likely to retire in their 60s; men are more likely to retire in their 70s.
Diverse appointments drop
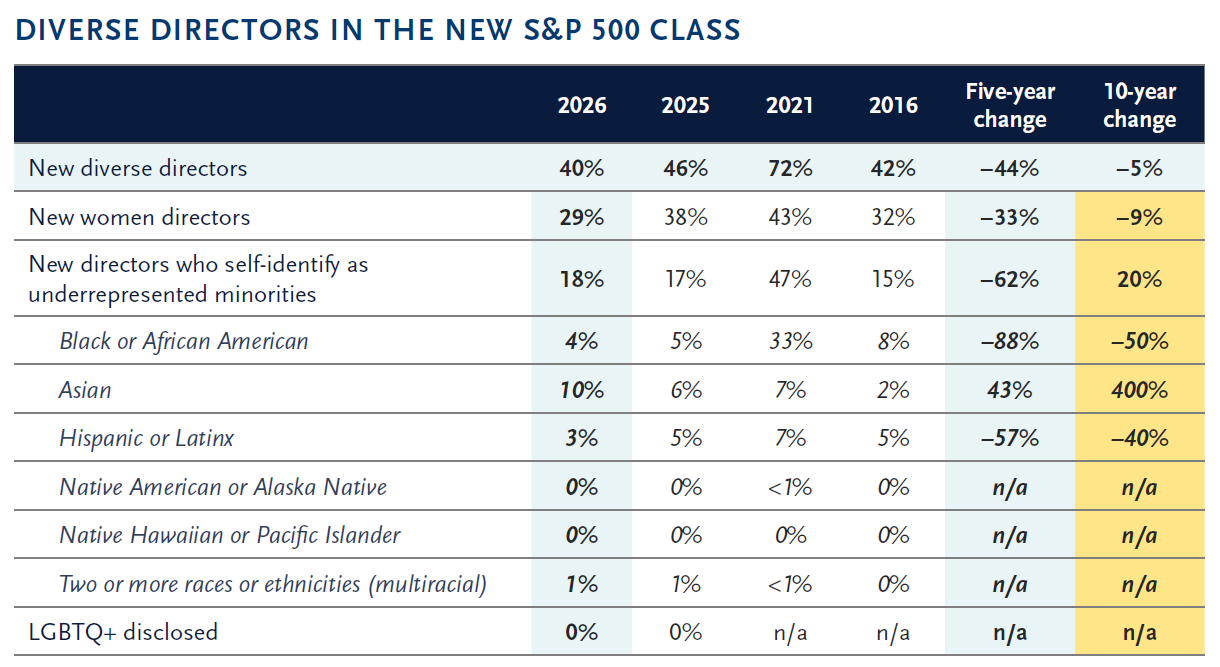
The share of director appointments filled by diverse* executives declined in 2026.
Women account for fewer director appointments this year, and the percentage of boards expanding to add one or more women directors is unchanged since last year at 10%.
However, the share of new directors who self-identify as underrepresented minorities increased slightly, and more boards have expanded to add one or more directors from this group: 6%, compared with 5% in 2025.
Women directors represent a smaller share of underrepresented minority appointments in 2026: 7%, compared with 9% last year.
Diverse appointments reflect a broad range of professional experiences
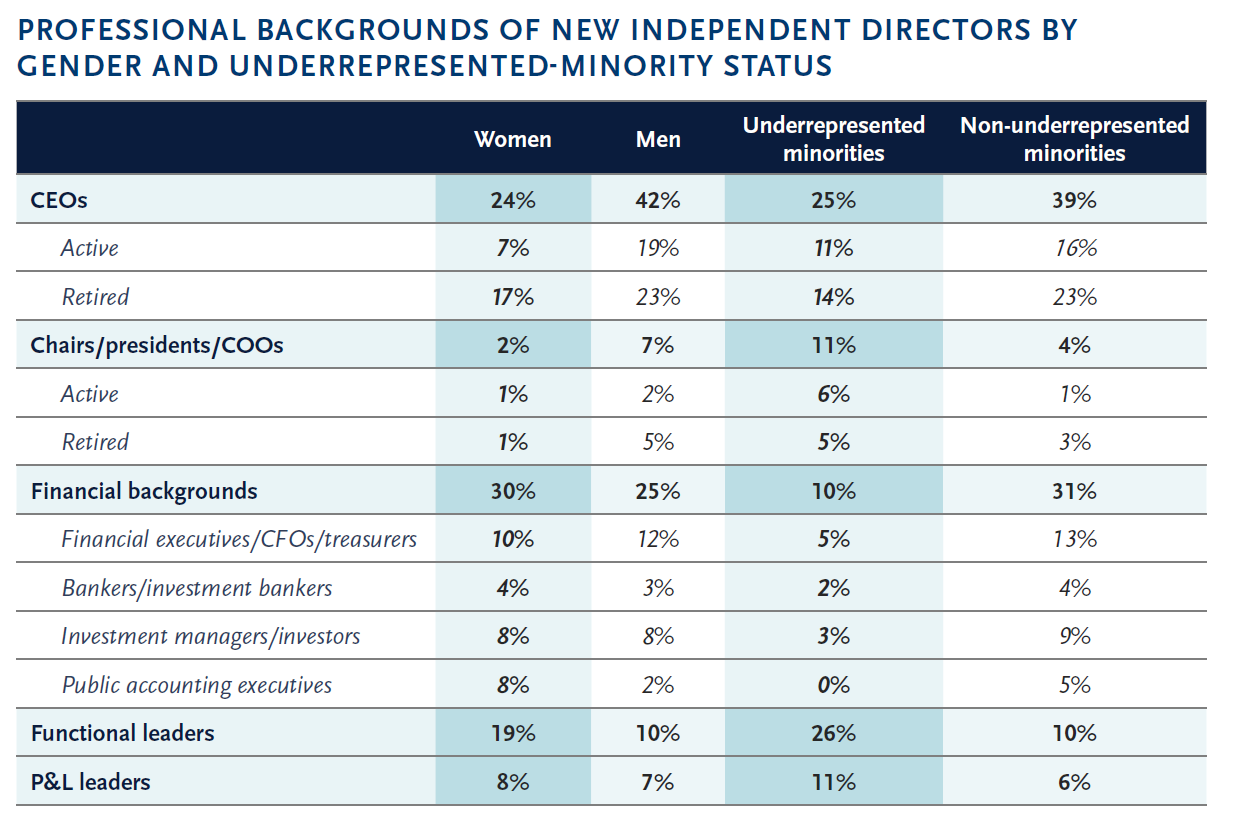
Diverse director appointments are more likely than non-diverse appointments to come from functional leadership roles (e.g., CHRO, CMO, CTO).
Among new women independent directors, over half bring CEO or financial experience, with a notable increase in CEO backgrounds driven by retired CEOs, who accounted for 17% of appointments, compared with 6% last year. The number of women serving as S&P 500 CEOs increased by 4%, from 46 in 2025 to 48 in 2026.
Among new directors who self-identify as an underrepresented minority, half are functional executives or bring CEO experience. CEO representation has grown since last year, from 22% to 24%. There’s been a rise in the number of underrepresented minorities serving as CEOs overall: from 67 in 2025 to 74 in 2026 (a 10% increase).
Diverse next-gen and first-time director appointments fall
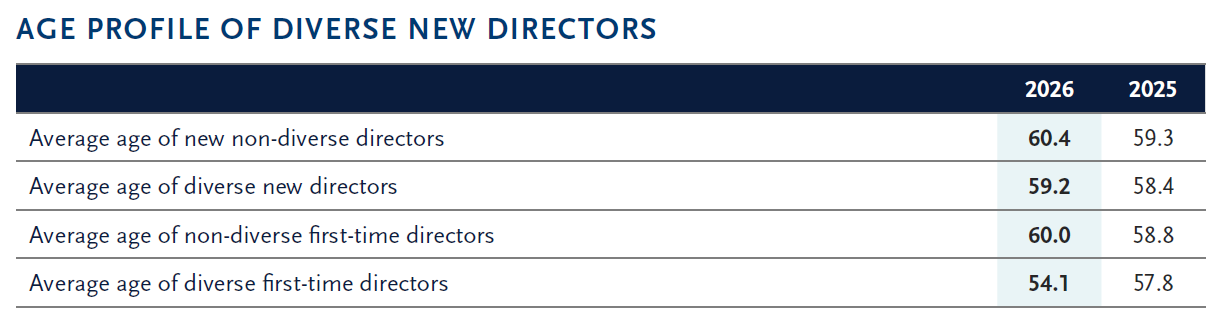
The average age of diverse new directors increased slightly in 2026, though they remain younger than new directors who are not diverse.
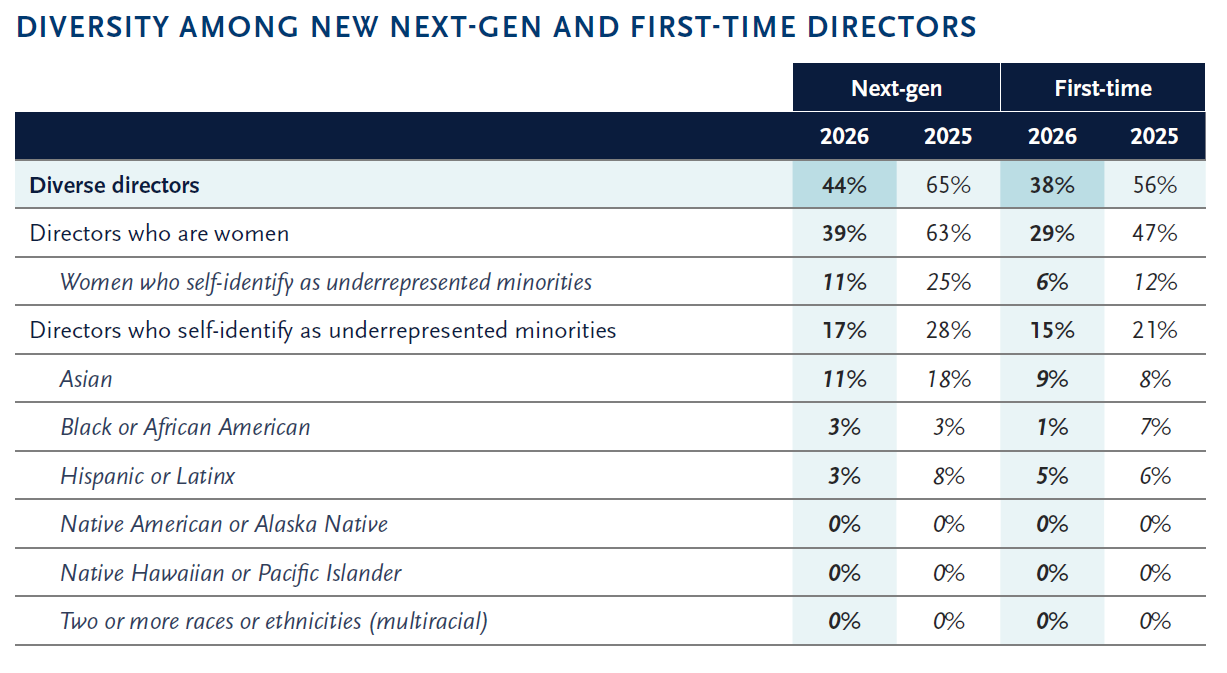
The share of diverse next-gen appointments fell sharply, dropping to 44% in 2026 from 65% in 2025. Women continue to make up the majority of this group, but both the representation of women and the proportion of next-gen directors who self-identify as underrepresented minorities declined significantly from last year.
Boards also appointed fewer first-time directors from diverse backgrounds. The representation of women has declined significantly to 29% from 47% in 2025, and the proportion of first-time directors who self-identify as underrepresented minorities continues to fall from its 2021 peak — from 65% then to 15% in 2026.
Global experience remains part of the boardroom mix
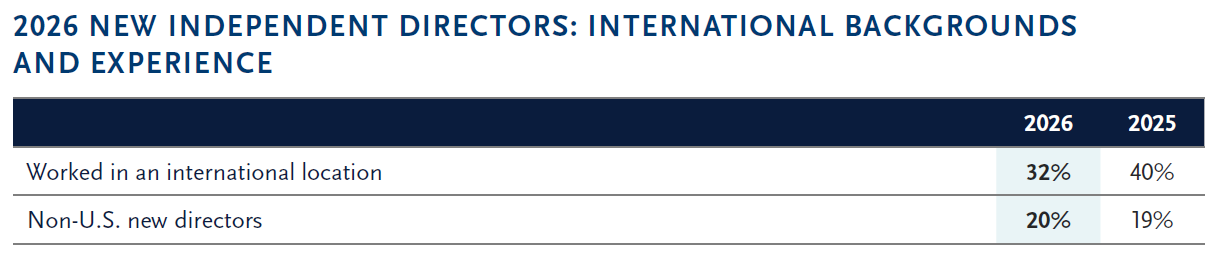
S&P 500 boards have significantly decreased their appointment of directors who have worked abroad, continuing a downward trend in recent years.
The proportion of new directors born outside the U.S. has increased one percentage point from last year to 20% and has more than doubled from a decade ago (8%).
S&P 500 boards are prioritizing technological and manufacturing backgrounds
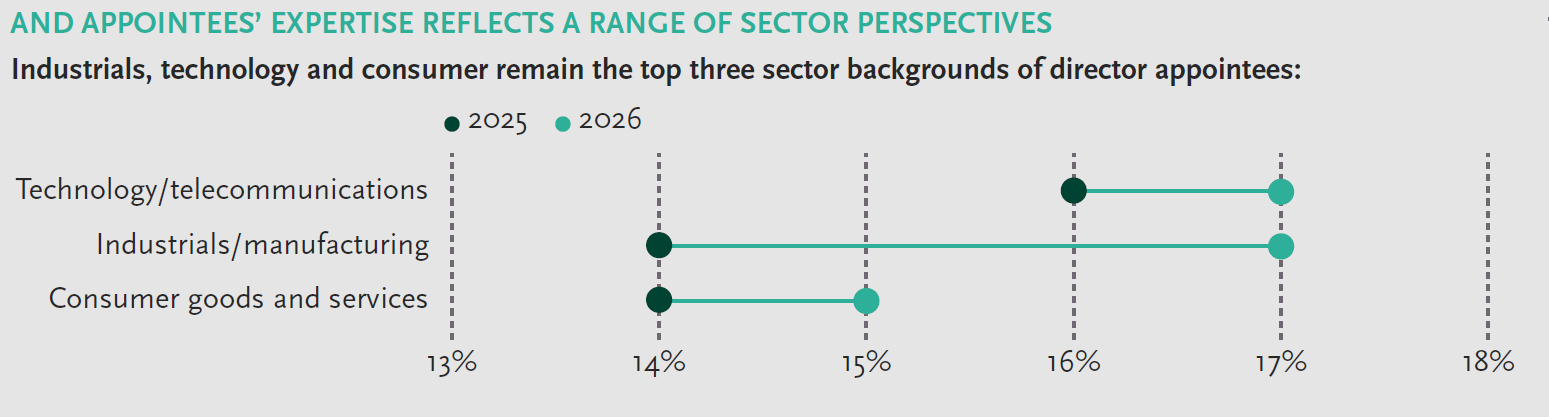
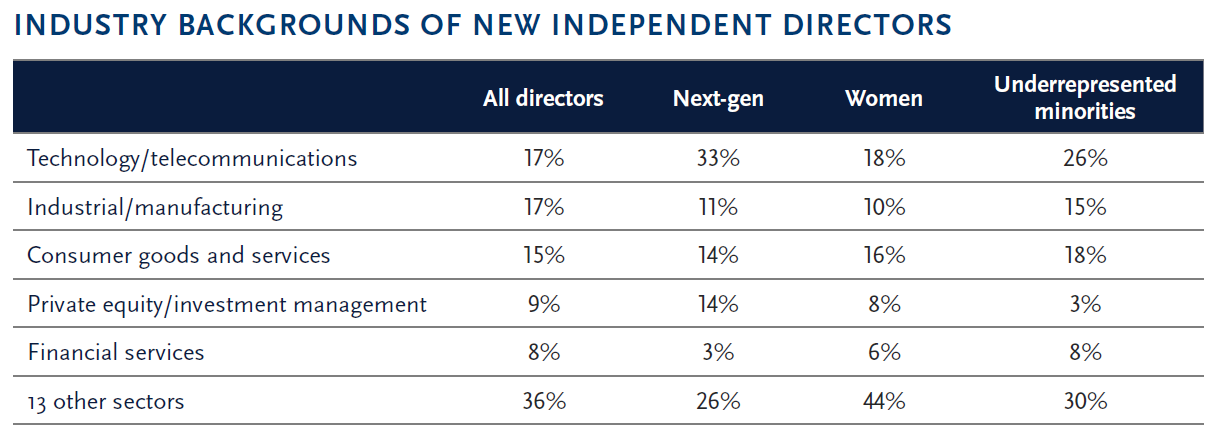
Technology/telecommunications and industrial/manufacturing are the most common industry backgrounds of the class of 2026, each accounting for 17% of appointments. The last time industrial/manufacturing was the leading industry background for new directors was in 2001.
Technology/telecommunications is the most common industry background for new next-gen directors, new women directors and new directors who self-identify as underrepresented minorities.
Highlights: Diversity — S&P 500 directors
Board diversity holds steady as boards pull back on disclosure
While boardroom diversity in the S&P 500 has remained largely flat, a more notable shift is emerging: fewer boards are disclosing diversity data and formal policies.

Diversity in the boardroom is largely unchanged
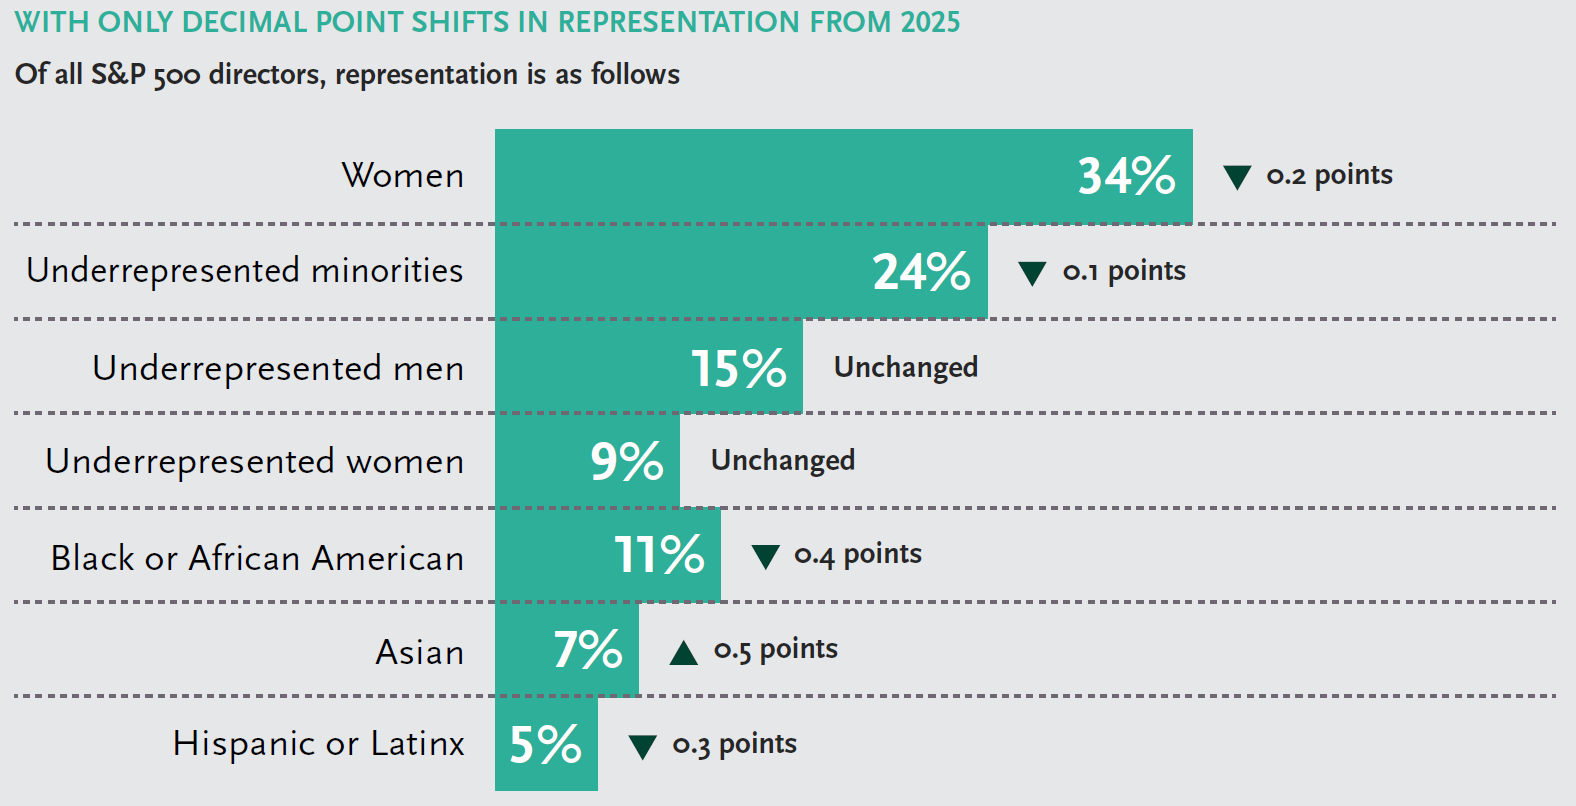
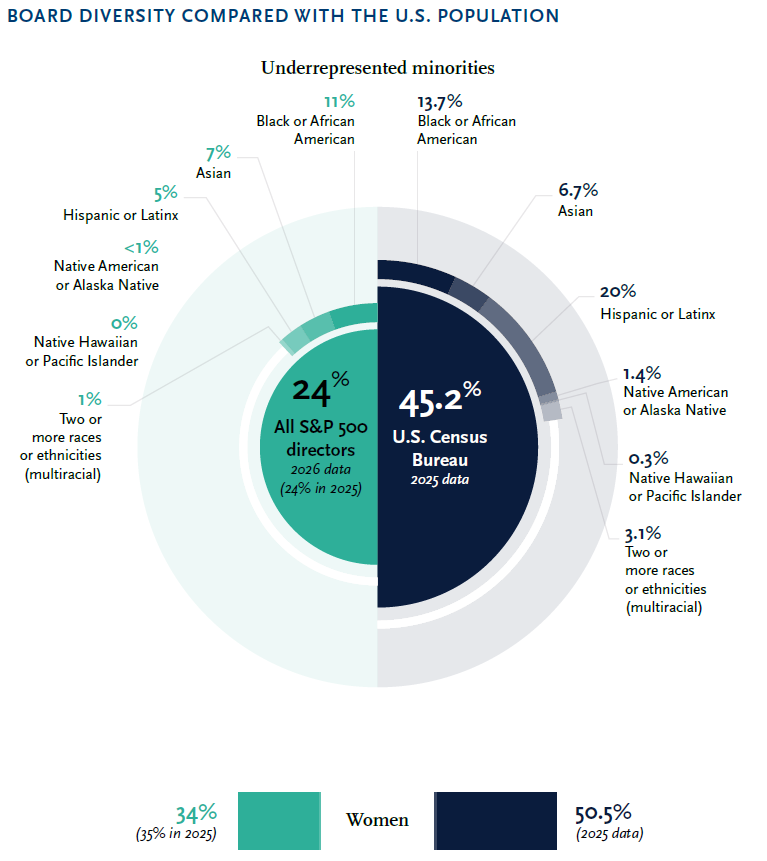
Diversity in the S&P 500 continues to plateau. Representation of underrepresented minorities remains flat at 24%, while the representation of women marginally declined by 0.2 percentage points, from 34.6% to 34.4%. Similarly, overall diversity fell by just 0.3 percentage points, from 49.6% to 49.3%.
Underrepresented minority representation is unchanged
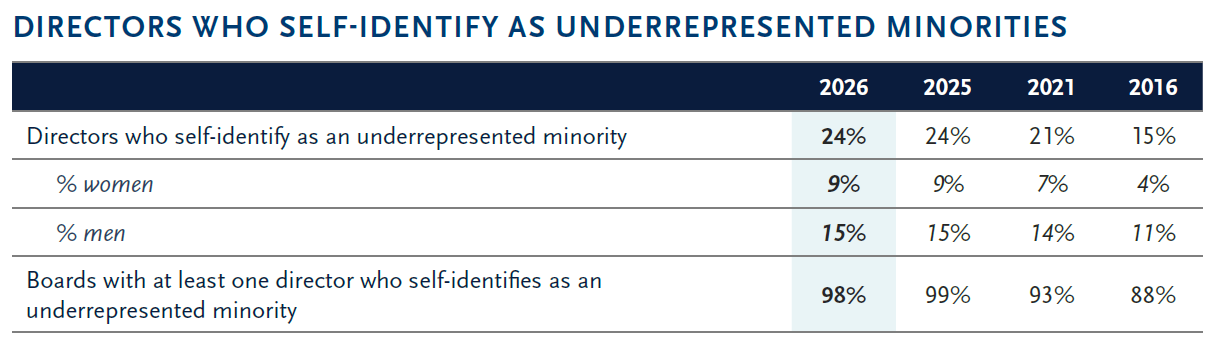
Like last year, 24% of S&P 500 directors self-identify as underrepresented minorities, up from 21% in 2021 and 15% in 2016.
All but eight boards (98%) have at least one director who self-identifies as an underrepresented minority. This is a decrease from last year (99%), when just five boards did not have at least one director who self-identified as an underrepresented minority. But it is still a meaningful increase from a decade ago (88%).
The gender distribution is unchanged from last year. Notably, the proportion of women directors in this group has more than doubled since 2016. Two boards disclosed having a director who self-identifies as LGBTQ+.
Women make up more than a third of S&P 500 directors
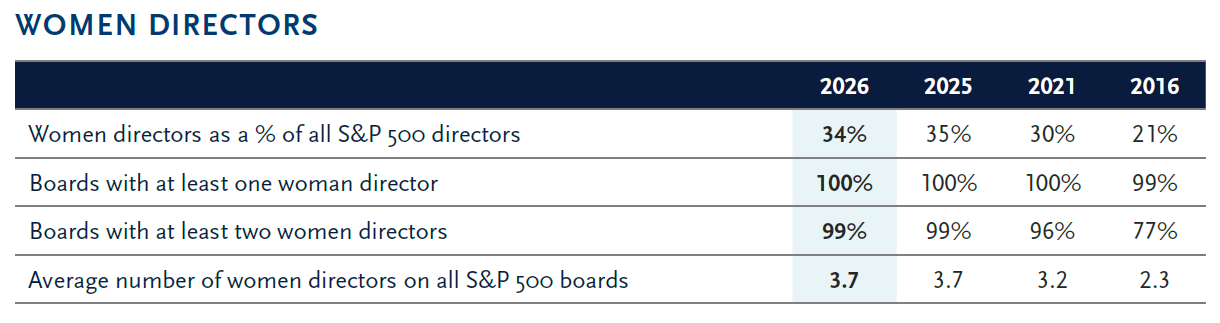
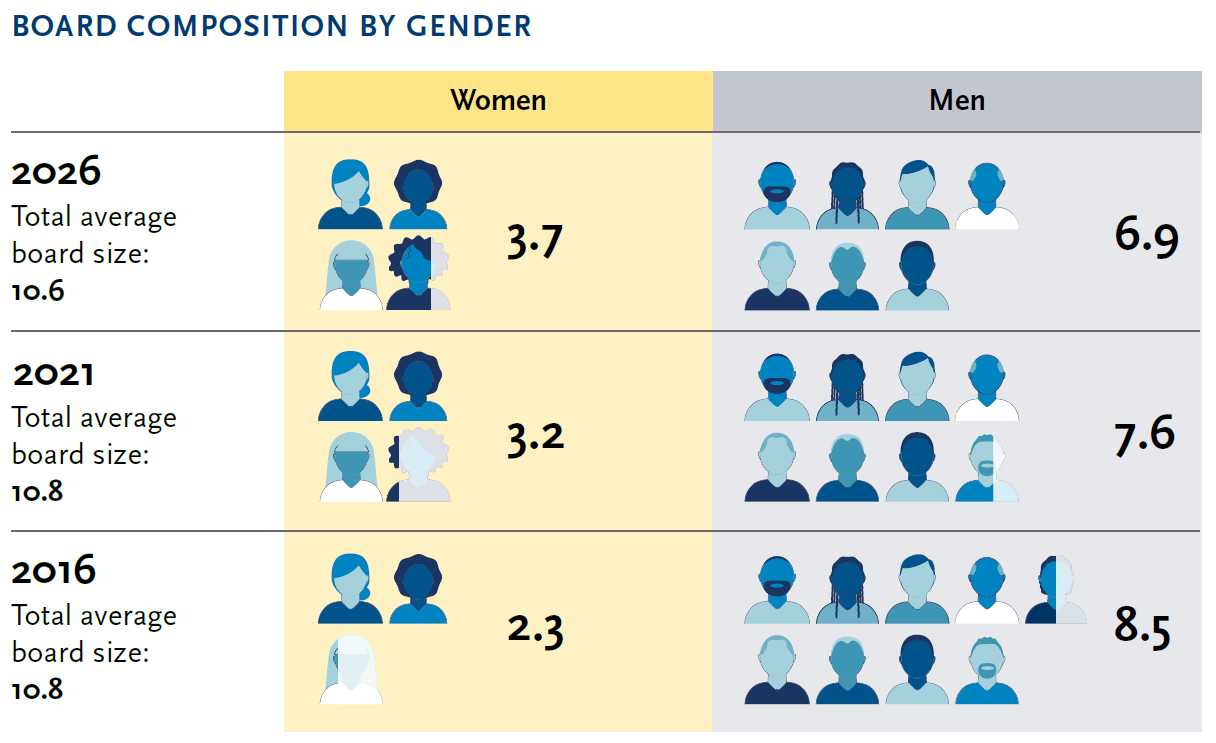
Like last year, women account for just over a third of S&P 500 directors (34% vs. 35% in 2025). This is a 16% increase from five years ago and a 62% increase from a decade ago. S&P 500 boards average four women directors, the same as last year, compared with three in 2021 and two in 2016. Nearly all boards (99%) have two or more women directors; only four boards have just one.
Diverse representation in board leadership is a mixed picture
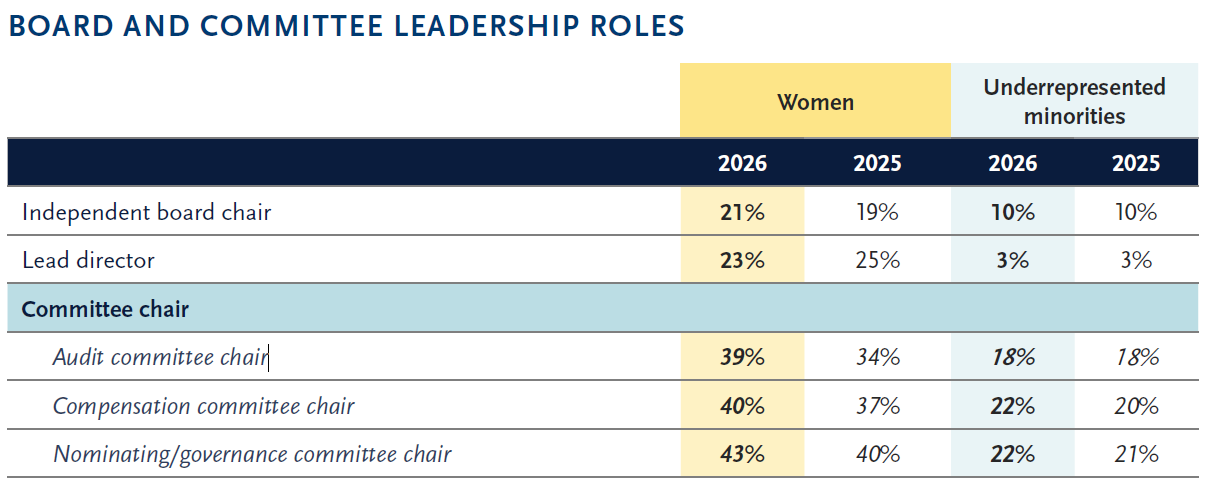
Women’s representation among independent board chairs increased in 2026, while the share of women lead directors declined slightly from last year.
The representation of women among committee chairs continued to grow, particularly on audit committees and across compensation and nominating/governance committees.
Representation of directors who self-identify as underrepresented minorities in board leadership roles is broadly unchanged from 2025. Their committee leadership generally increased year over year.
Boards are moving away from formal diversity policies
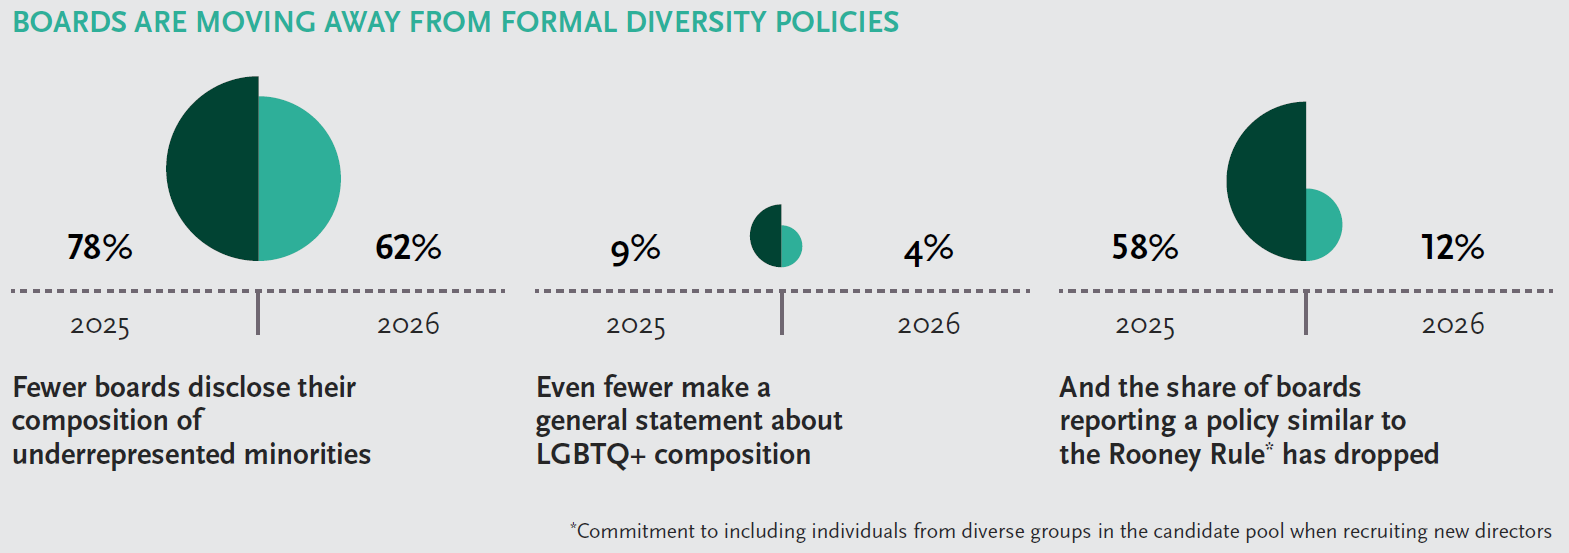
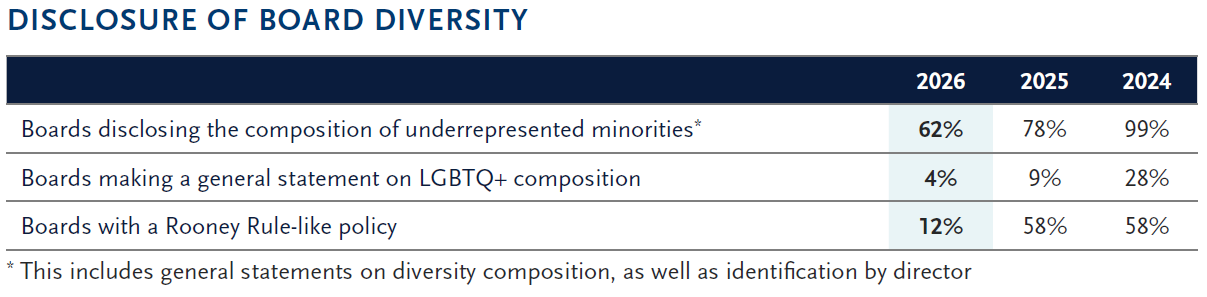
Companies continue to pull back on disclosing aggregate information on directors who self-identify as underrepresented minorities. We see a similar trend in LGBTQ+ disclosures.
The share of boards observing a policy like the Rooney Rule, which requires the inclusion of individuals from diverse groups in the candidate pool when recruiting new directors, has fallen sharply: from 58% in 2025 to 12% in 2026. In 2021, 39% of boards observed such policies.
The complete publication is available here.
Legal Disclaimer:
EIN Presswire provides this news content "as is" without warranty of any kind. We do not accept any responsibility or liability for the accuracy, content, images, videos, licenses, completeness, legality, or reliability of the information contained in this article. If you have any complaints or copyright issues related to this article, kindly contact the author above.
